Containers
Building a single-pane NOC dashboard for Amazon EKS with Amazon CloudWatch
An incident is the worst moment to discover that you cannot trust the Network Operations Center (NOC) dashboard for your Amazon Elastic Kubernetes Service (Amazon EKS) cluster. A blank widget can mean either that the workload is healthy or that telemetry has stopped. An availability number can hide a failing service behind a quiet one. A wall display can answer none of the questions an operator is asking. Each costs response time. This post shows you what a trustworthy NOC for Amazon EKS on Amazon CloudWatch looks like and why each design choice matters. It also shows how to have one running in your account in about 15 minutes.
The challenge is structural. On an Amazon EKS cluster, the Amazon CloudWatch Observability EKS add-on sends Kubernetes metrics to CloudWatch through the OpenTelemetry Protocol (OTLP), and you query them with PromQL. AWS calls this OpenTelemetry (OTel) collection path OTel Container Insights. The application services publish golden signals through Amazon CloudWatch Application Signals. Elastic Load Balancing, Amazon DynamoDB, Amazon Relational Database Service (Amazon RDS), Amazon ElastiCache, and Amazon MQ publish to CloudWatch metric namespaces. No single widget type reaches all of these signals, so the NOC combines PromQL chart widgets with CloudWatch metric widgets.
We validated this sample on Amazon EKS Auto Mode, but the dashboard pattern also works on standard Amazon EKS clusters with supported Linux worker nodes. For a standard cluster, use Kubernetes 1.28 or later and install version 6.2.0 or later of the Amazon CloudWatch Observability EKS add-on. Then enable OTel Container Insights, configure EKS Pod Identity or AWS Identity and Access Management (IAM) roles for service accounts (IRSA), attach CloudWatchAgentServerPolicy to the node IAM role, and allow outbound access to CloudWatch endpoints. We validated the queries in this post with add-on v6.4.0-eksbuild.1. Rerun the probe if you use another version. Only the scale-in discussion later in the post applies specifically to Auto Mode.
The complete solution lives in the sample repository on GitHub. It contains a builder that generates a 35-widget NOC and three drilldowns for the AWS retail store sample application. You validate every query against live telemetry with the included probe before deployment. The repository also holds the alarms the NOC depends on, tests, and an agent skill so that your AI assistant can adapt it to your cluster. This post focuses on the result and the reasoning. The code is there when you want it, and most readers will not need to open it.
Solution overview
Read the NOC in three passes: is service traffic healthy, is anything broken now, and is the infrastructure healthy? This order tells you whether to stay on the overview or open a drilldown. Keep the customer-impact service level indicator (SLI) separate from the estate-wide numbers, and source it from a front-door service or a synthetic transaction.
The following diagram shows the architecture. The add-on sends Kubernetes telemetry to CloudWatch through OTLP, and you can instrument the application services for Application Signals. A builder composes PromQL chart widgets and CloudWatch metric widgets into the NOC and the drilldowns, and emits query manifests that you validate with a probe before running PutDashboard.
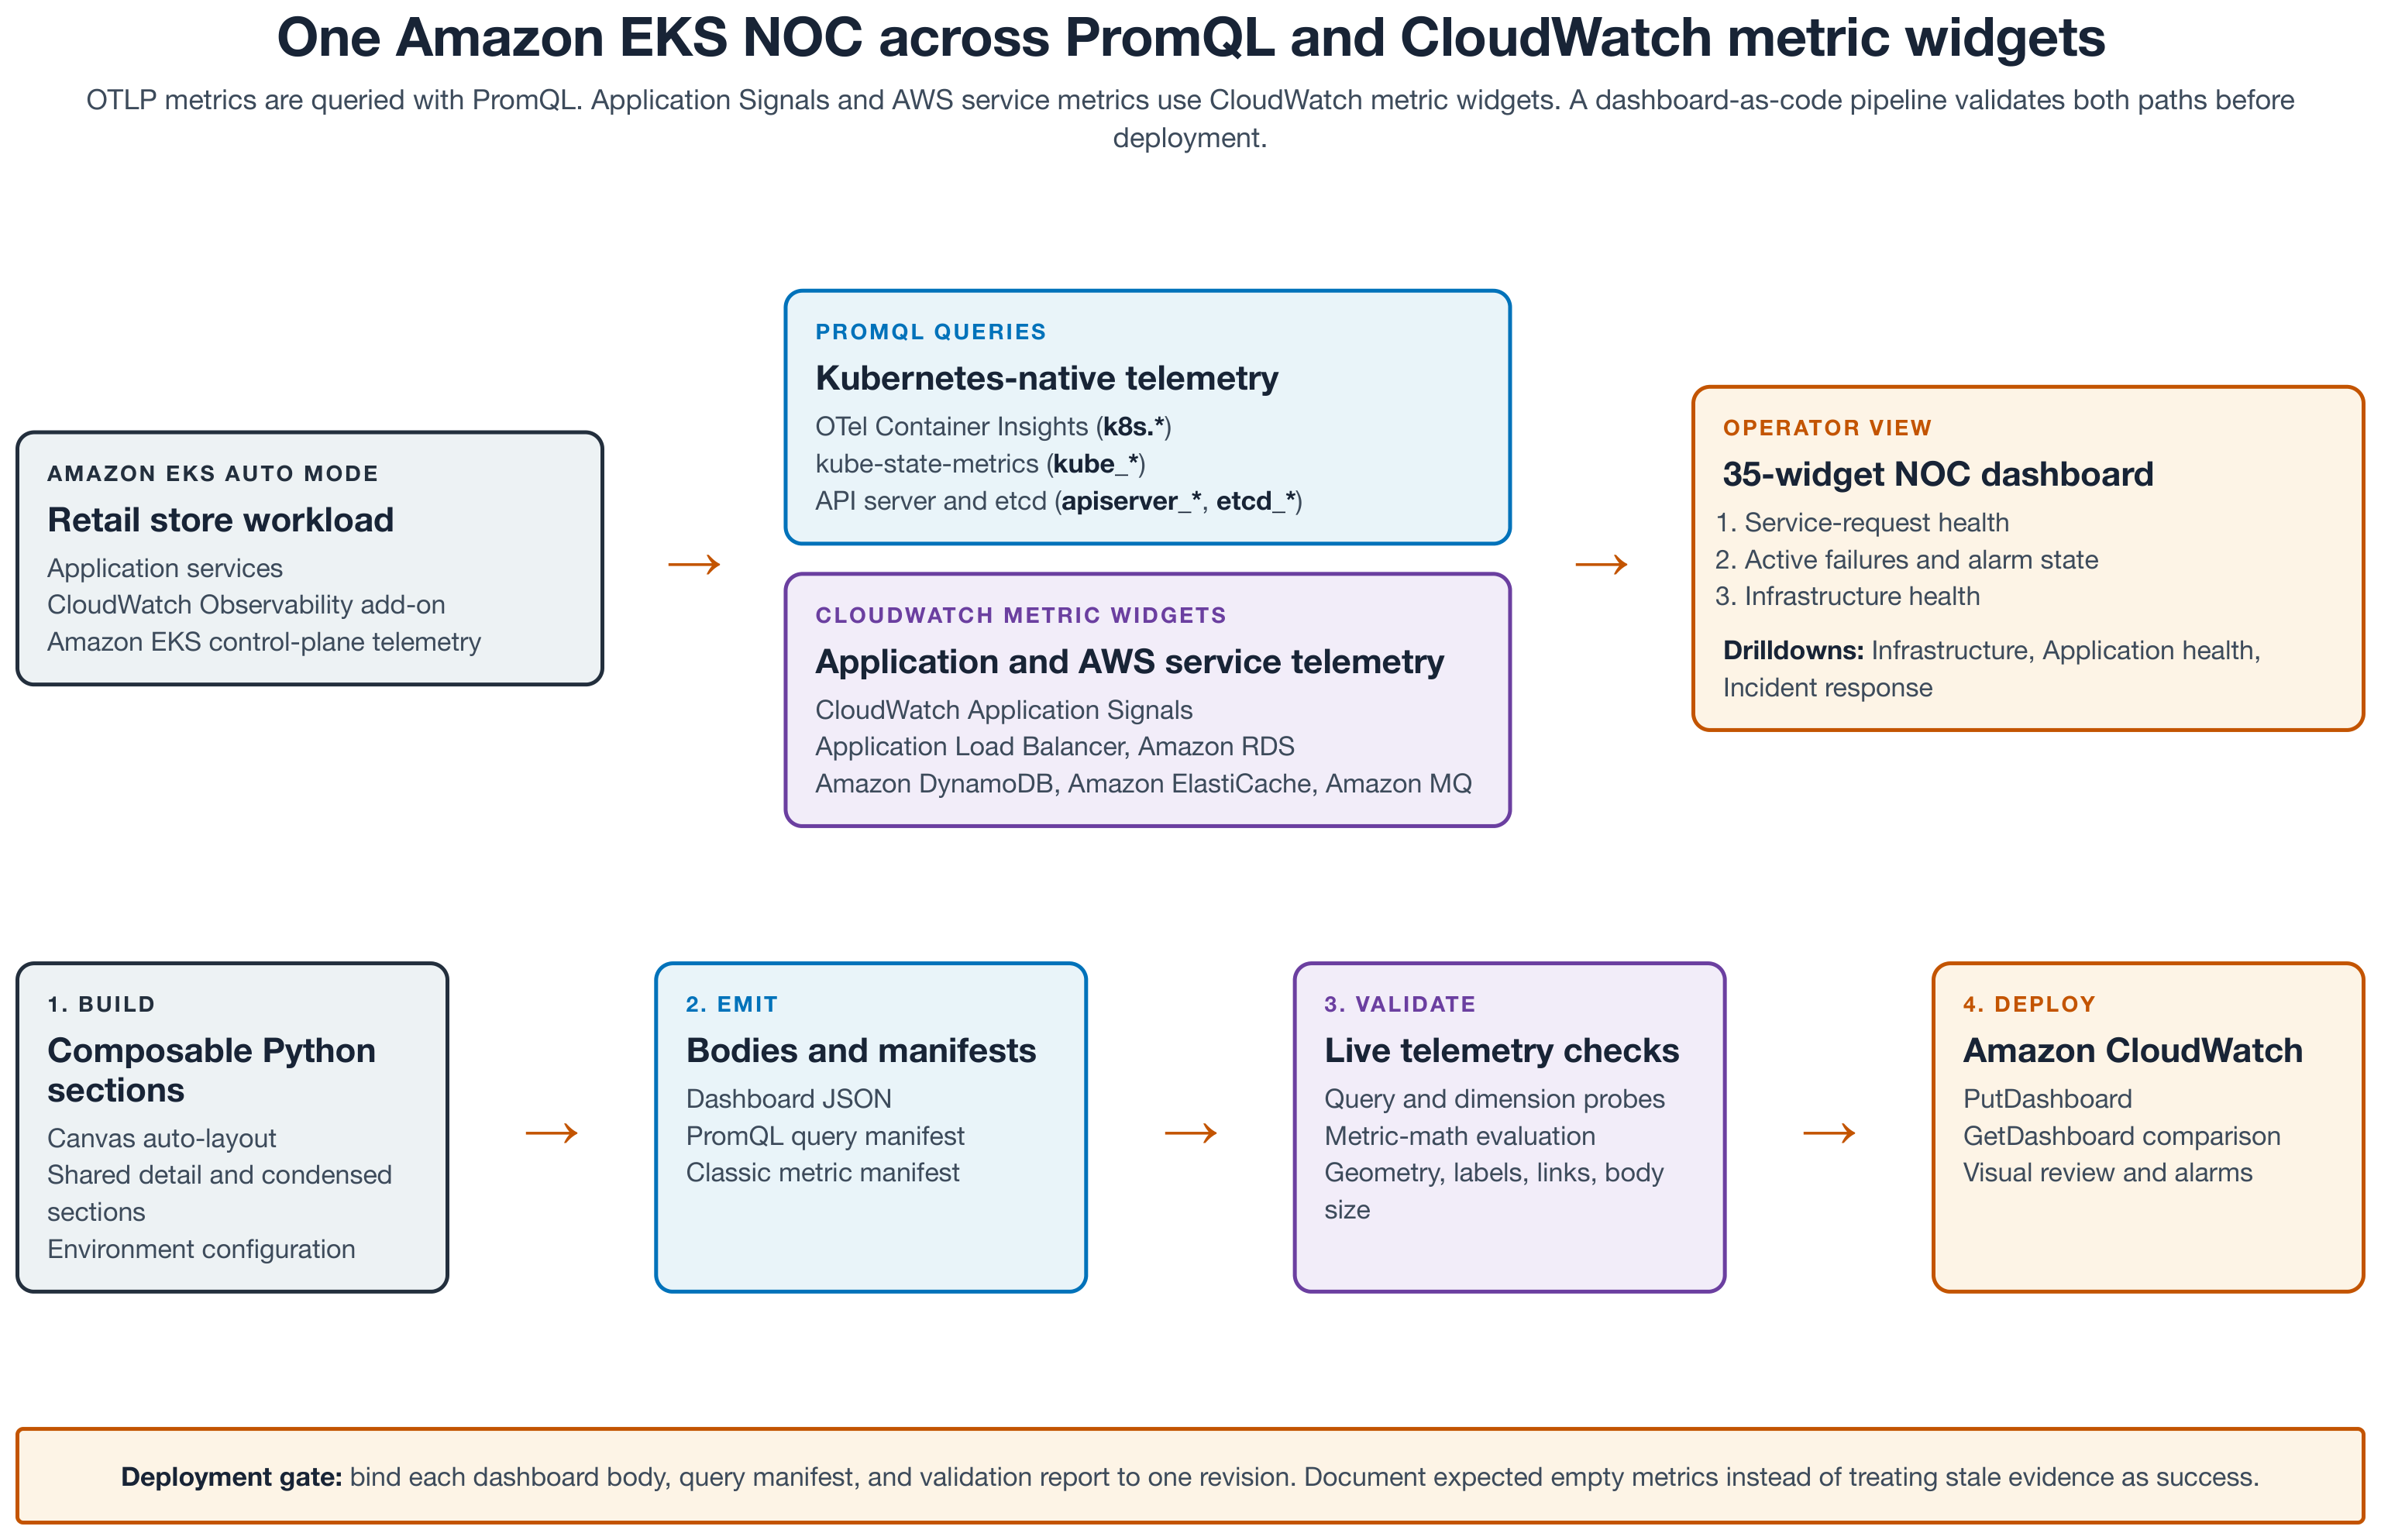
Figure 1: The builder composes PromQL queries and CloudWatch metric widgets into an Amazon EKS NOC that you validate before deployment
One module defines four sections: executive summary, incident response, application health, and infrastructure. The NOC receives the condensed version of every section. Each drilldown receives the full version of one section. Because both views come from the same function, a query fix lands in the NOC and its drilldown at the next build. The two can never disagree about a counter. The following table summarizes the four dashboards.
Default lookback is the amount of recent data that CloudWatch displays when each dashboard opens.
| Dashboard | Widgets | Default lookback | Purpose |
| retail-store-noc | 35 | 3 hours | Single pane: executive rollup plus condensed sections |
| retail-store-eks-monitoring | 9 | 3 hours | Infrastructure: nodes, namespaces, control plane |
| retail-store-application-health | 11 | 3 hours | Golden signals, dependencies, Java Virtual Machine (JVM) heap, ingress, backing services |
| retail-store-incident-response | 12 | 1 hour | Triage: failure counters, alarms, saturation, log search |
The following diagram shows the reading sequence during an incident.
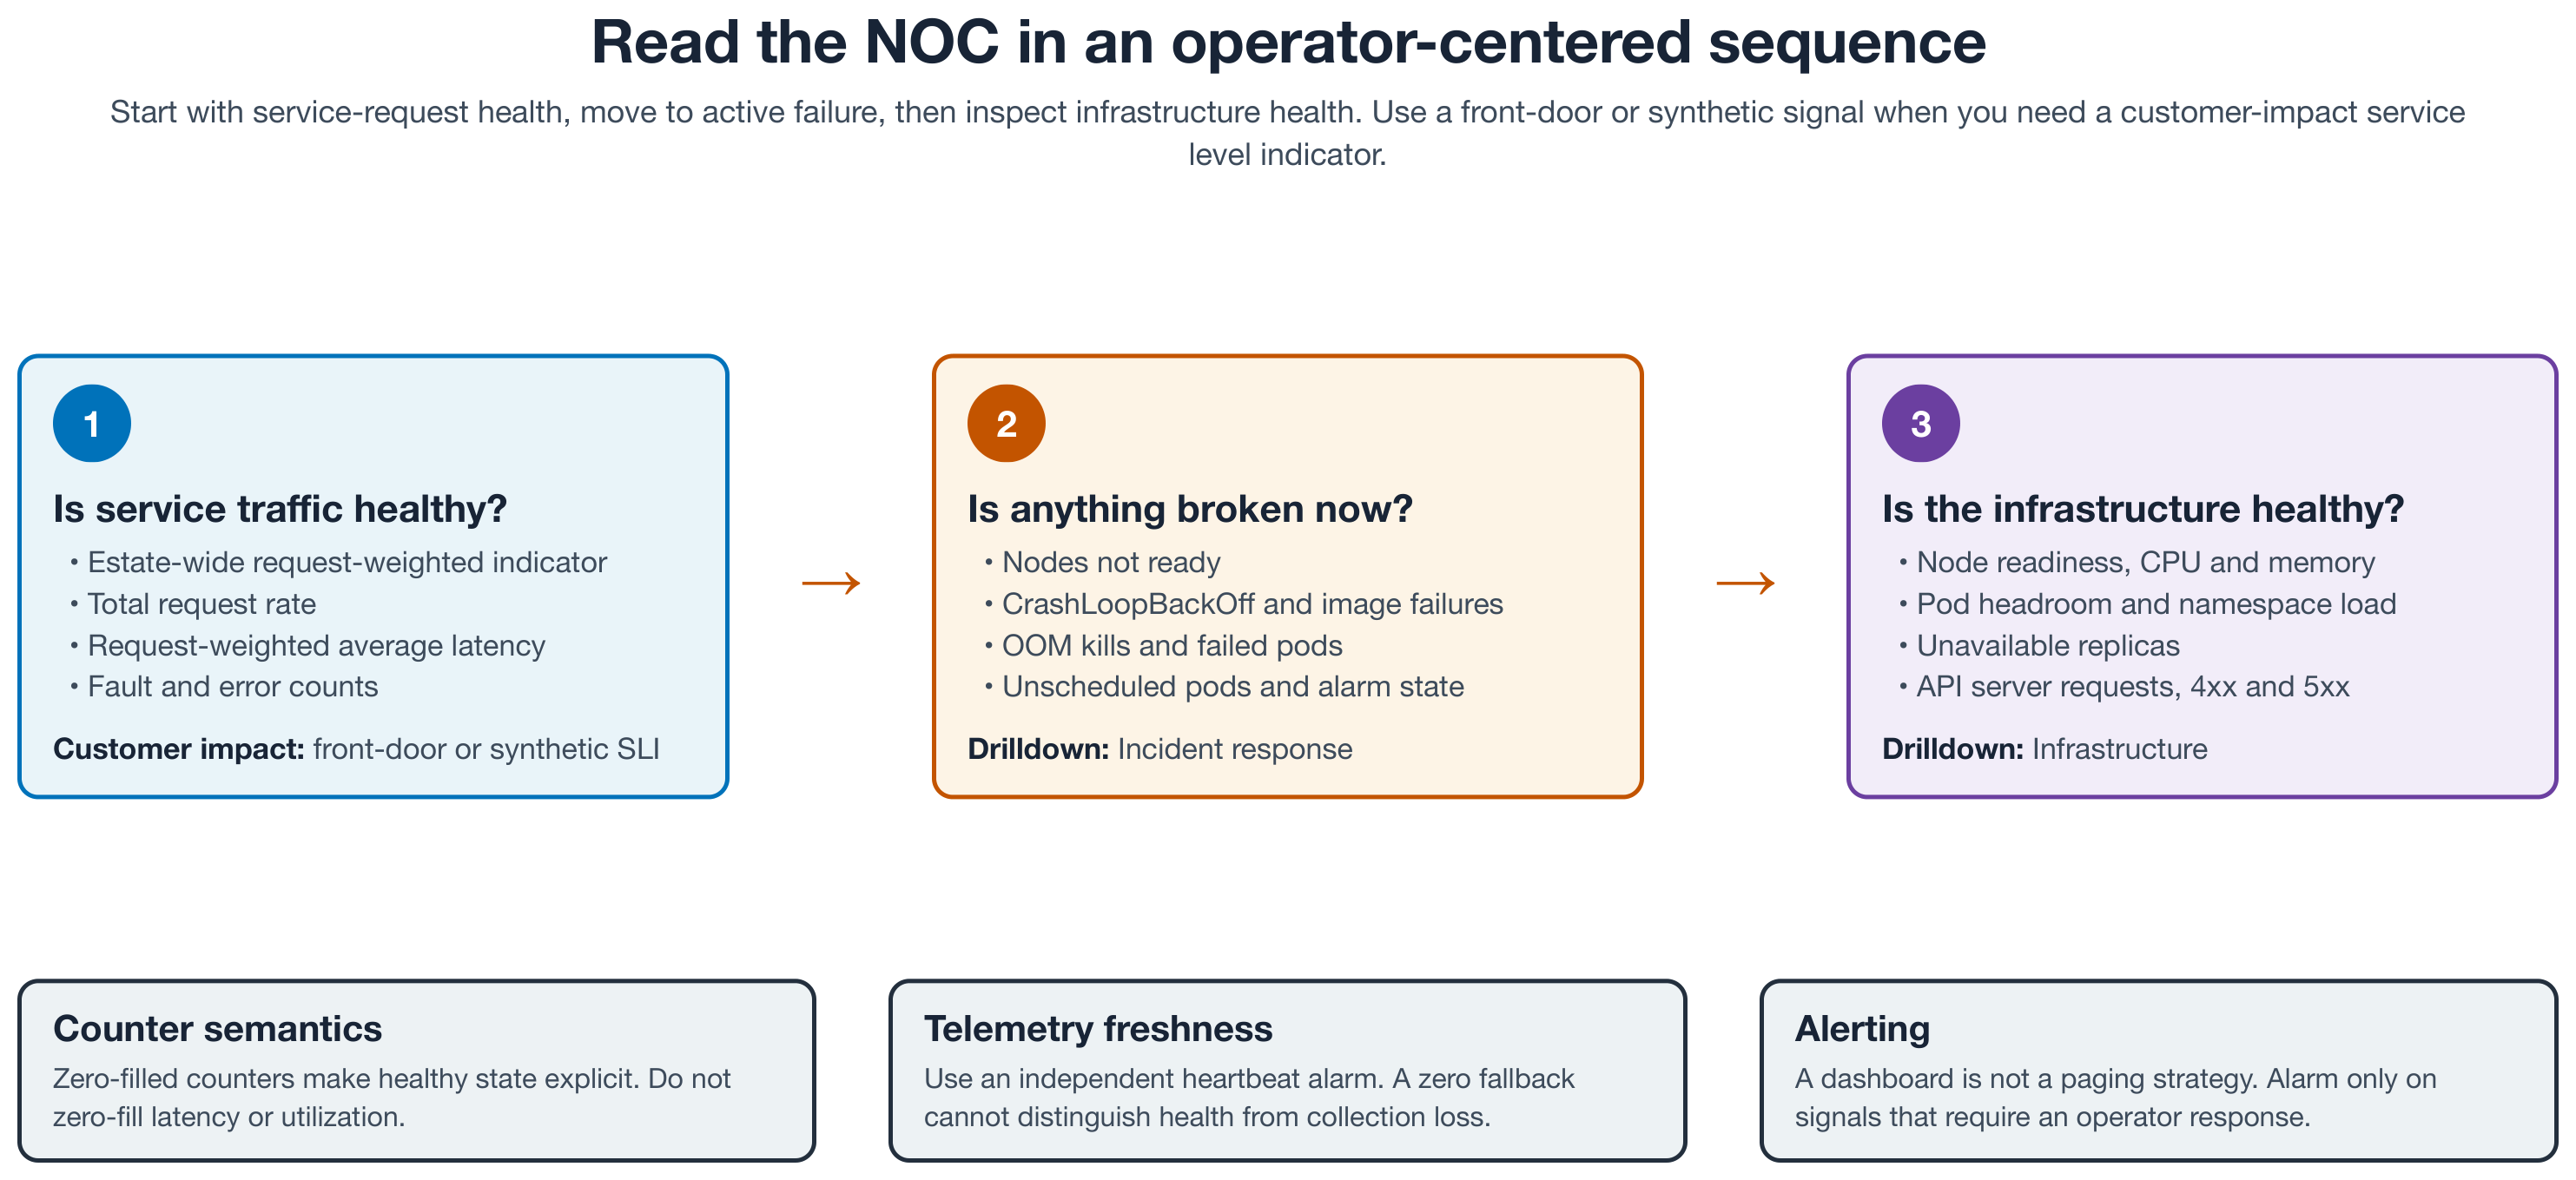
Figure 2: Operator-centered NOC reading sequence and drilldown path
The following screenshot shows the NOC as an operator sees it at the start of an incident: service-level and infrastructure summaries first, then the drilldown links, then the incident strip. The builder creates each link from the configured AWS Region and dashboard name, so the links resolve in the account and Region where you deploy.
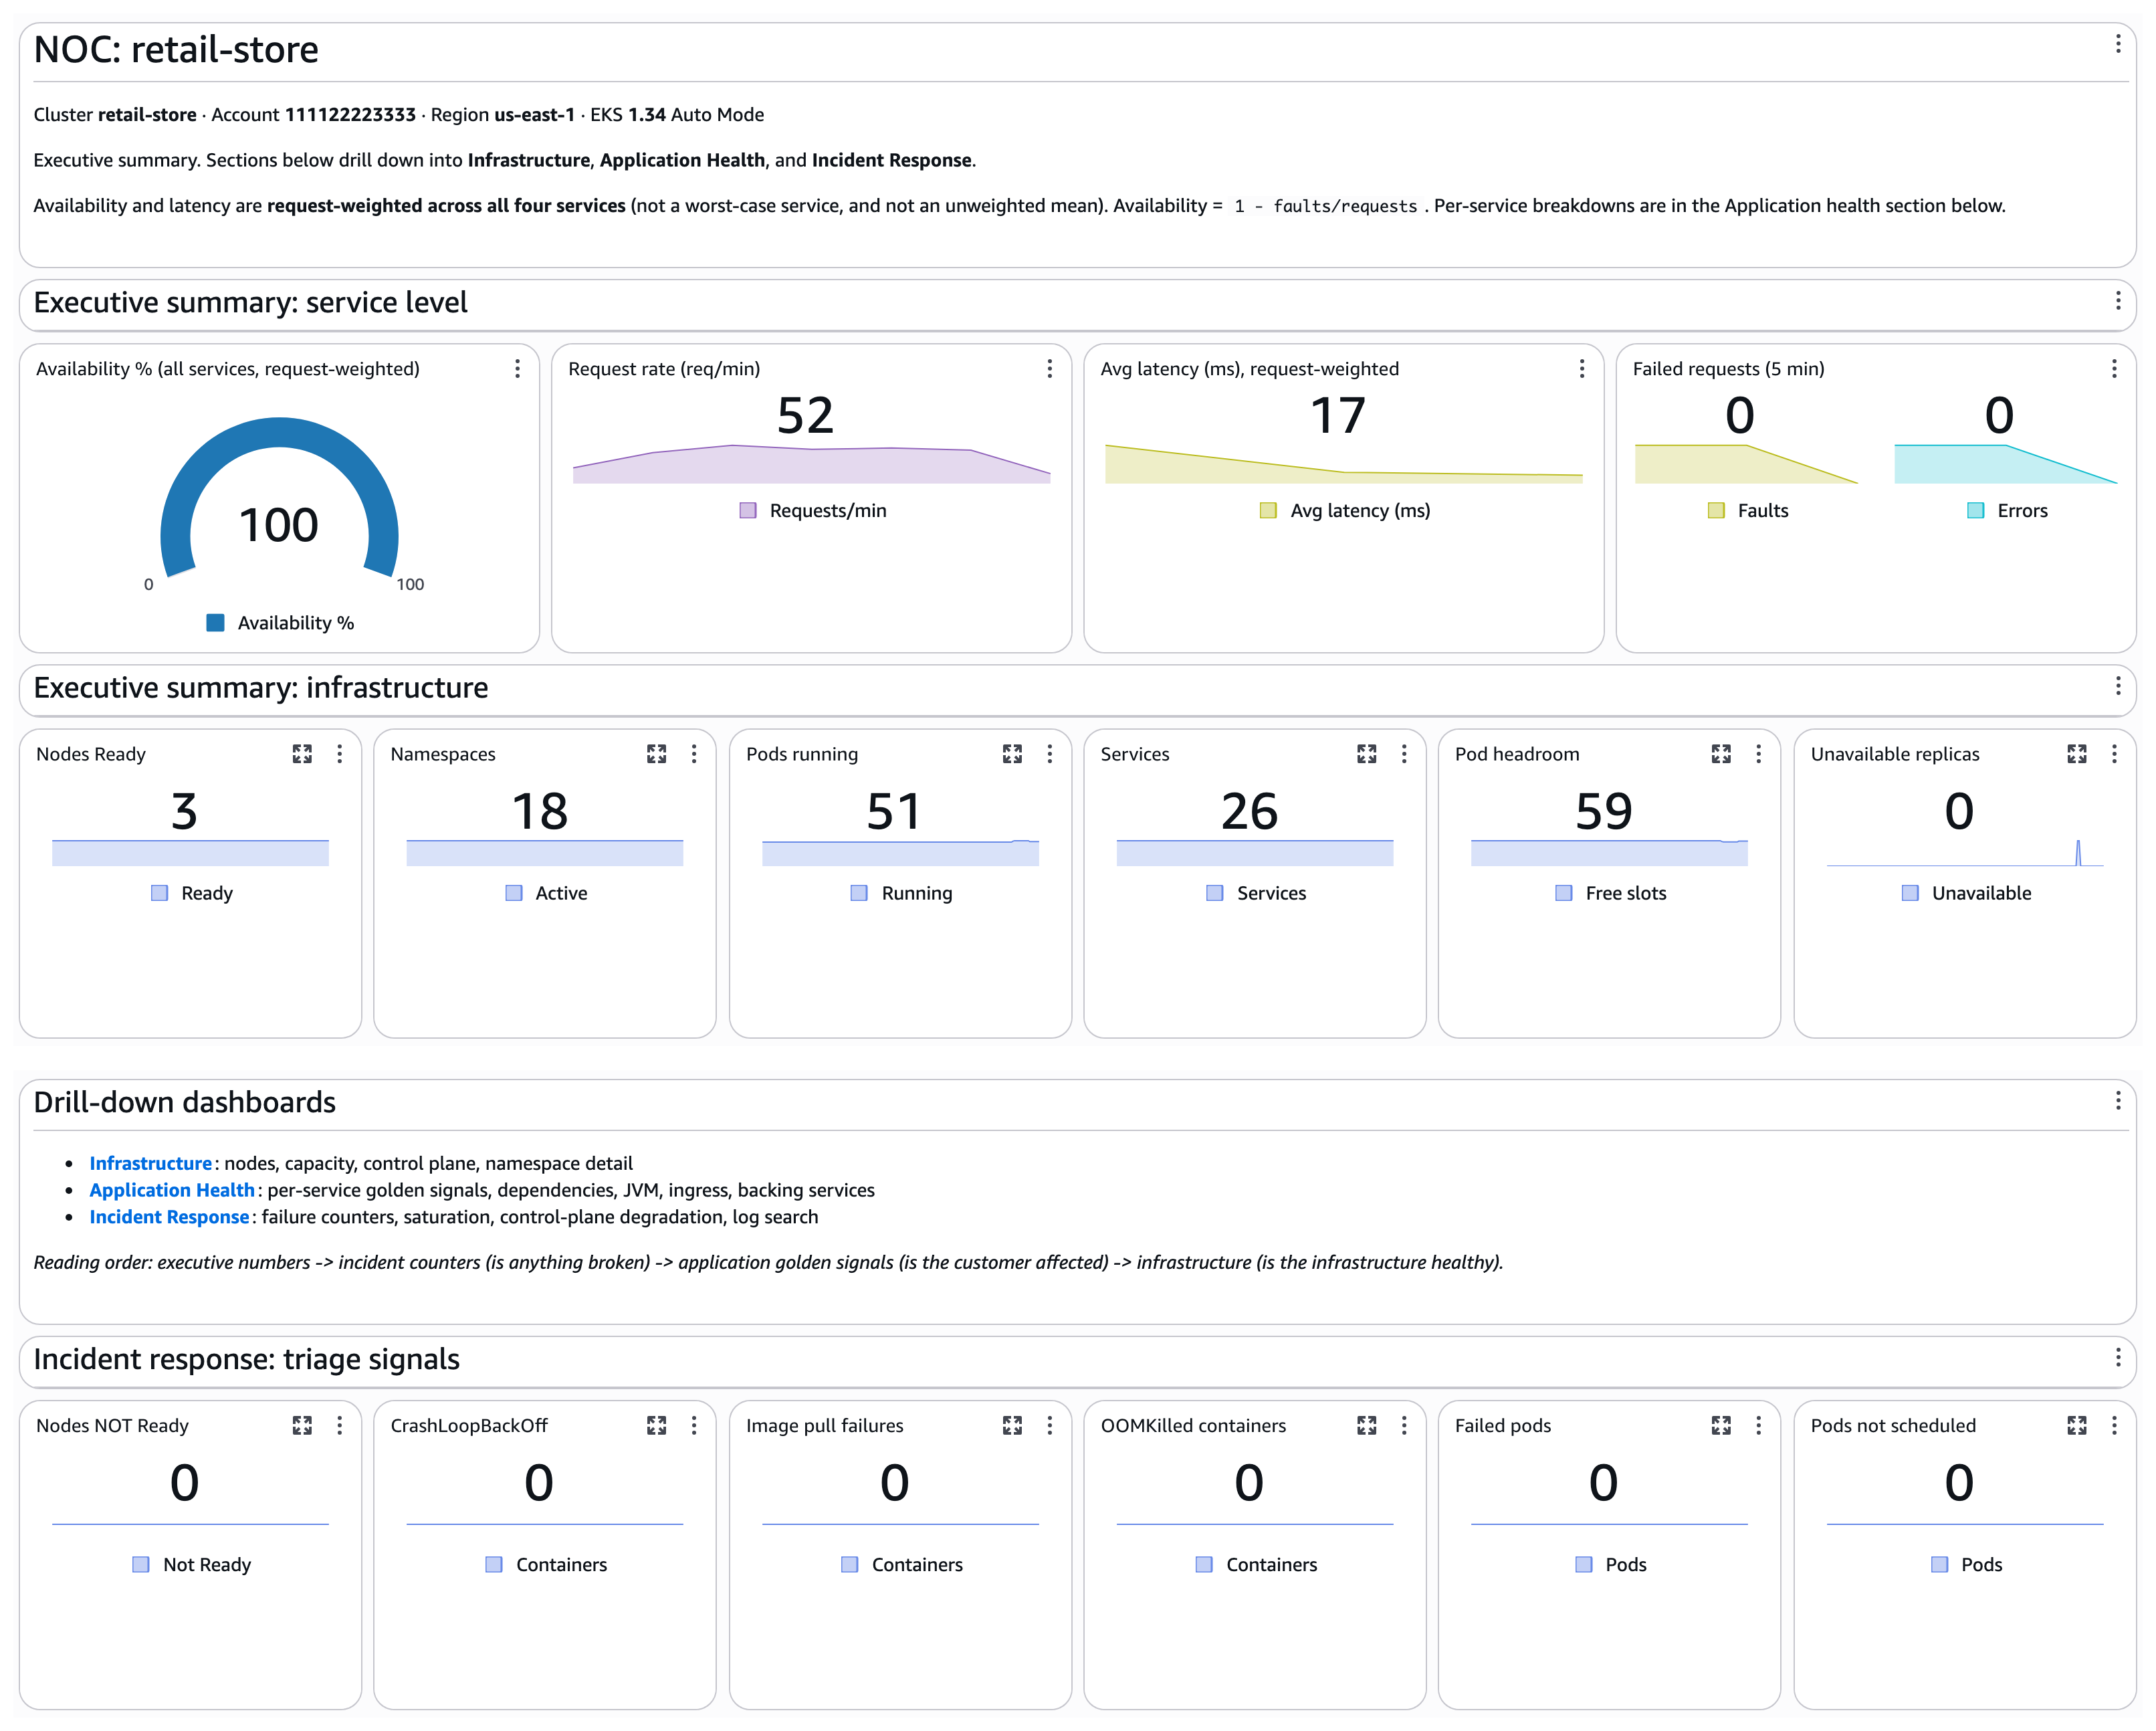
Figure 3: The NOC overview after you deploy, showing the service-level summary, infrastructure summary, drilldown links, and the incident strip (values reflect the sample workload at capture time)
What makes this NOC trustworthy
Four design decisions do most of the work. Each one is small on its own. Together they remove the three failure modes from the introduction. The patterns reference in the repository has the full PromQL for each.
Every signal comes from the right plane, scoped to one cluster
Kubernetes state (kube_*), node and pod resources (k8s.*), and control plane metrics (apiserver_*, etcd_*) live in the PromQL store. Golden signals live in the ApplicationSignals namespace, and ingress and backing services live in their AWS namespaces. A widget that queries the wrong plane returns nothing, and the failure is silent. Every PromQL query also carries the cluster selector "@resource.k8s.cluster.name"="retail-store", because a second cluster in the same account would otherwise pollute every number without any error. The builder appends the selector for you and the tests fail if a query lacks it.
The headline numbers are request-weighted
Averaging per-service averages gives a low-volume service the same influence as a high-volume one, and a worst-of-N composite is no better because the worst service changes between datapoints. The executive tiles weight by requests, using Application Signals metric semantics. Fault counts 5xx responses and span errors, Error counts 4xx responses, and Latency with the SampleCount statistic supplies the request count.
The failed-request tile shows counts rather than rates and labels them Faults and Errors. Zero is unambiguous, and any non-zero count is actionable.
Healthy reads zero, and an alarm backs every zero
The kube-state-metrics exporter emits *_reason series only while a condition exists, so a healthy cluster returns no series for CrashLoopBackOff and the widget renders blank. An operator cannot tell blank-because-healthy from blank-because-the-pipeline-broke. Every counter on the incident strip therefore ends in or vector(0), and the equivalent CloudWatch metric widgets use FILL(m,0), so healthy reads an explicit 0. The rule applies only to counters and state conditions. A zero-filled latency would assert a measurement that never happened.
Zero-fill has one gap: It returns 0 when a condition is absent and the same 0 when telemetry has stopped. The repository’s alarms.sh addresses that ambiguity by creating two telemetry-freshness alarms and one node-readiness alarm. An Application Signals heartbeat on the front-door service treats missing data as breaching, and a PromQL alarm on absent_over_time(kube_node_info[15m]) covers the Kubernetes plane. A third alarm fires when a node is not Ready. CloudWatch supports PromQL alarms natively, and AWS publishes recommended PromQL alarms for Amazon EKS that these three extend.
Amazon EKS Auto Mode adds a wrinkle. It adds and removes worker nodes with demand and consolidates workloads as demand falls. A resource-scoped query can then return no series for the selected window and render blank rather than zero. Treat blank as a report of no samples for that selector and time range, and rely on the freshness alarms to separate expected scale-in from an observability failure.
The dashboards are tested code
A successful PutDashboard proves only that the JSON parsed. The builder records every PromQL query, metric reference, and log group in manifests, and the probe resolves each one against live telemetry. It reports OK, EMPTY, and FAILED separately for each plane, together with the SHA-256 hash of the body it validated. The following output is from the validated cluster while the sample application served traffic.
Treat FAILED as a blocking defect. Treat EMPTY as a workload condition to explain, never as success. The three EMPTY rows in the output are a DynamoDB table with no throttling and no DynamoDB calls in the window, which is the expected state. Dimension mistakes surface here as EMPTY rather than as errors, and the next section describes the one that nearly shipped.
Three things to check before you trust your copy
These came out of review, and the repository now catches each one before deployment.
The Application Signals Environment is the namespace, not the service name. On Amazon EKS, Application Signals identifies a service by Service and Environment, and the default Environment is eks:<cluster-name>/<namespace>, where namespace is the Kubernetes namespace the pods run in. The retail store sample deploys each service into a namespace of the same name. A builder that derived the value from the service name therefore passed every probe run, and it would have rendered every Application Signals widget EMPTY on almost any other cluster. The repository maps each service to its namespace explicitly in config.py, and python3 probe.py --discover lists the (Service, Environment) pairs Application Signals has recorded and flags any configured service that does not match.
A Logs Insights widget names its log groups inside the query. The dashboard body schema expects SOURCE '<log group>' entries at the start of the query string. There’s no logGroupNames field in the body. That name belongs to the AWS Cloud Development Kit (AWS CDK) construct. The probe confirms that each log group exists, and the tests check the syntax. Because GetMetricWidgetImage renders neither log widgets nor PromQL chart widgets, opening the deployed NOC on the console once is the only check that proves every widget draws.
Metric names and histogram formats are add-on-version specific. We validated everything in this post with the amazon-cloudwatch-observability add-on v6.4.0-eksbuild.1 on Amazon EKS Auto Mode running Kubernetes 1.34. With that version, apiserver_request_duration_seconds is a native histogram in the PromQL store, so there are no _bucket series and no le label, and histogram_quantile runs on the metric itself. The k8s.* names can also shift between versions. The probe prints the validated version with every report. Run it again after every add-on upgrade.
Walkthrough
We walk through the steps to deploy the NOC and its three drilldowns in your account, using the builder, probe, alarm, and deployment scripts, which you can download from the GitHub repo sample-code-for-noc-dashboard-on-eks-with-cloudwatch.
Prerequisites
You need the following before you begin:
- An Amazon EKS cluster where you installed the Amazon CloudWatch Observability EKS add-on with the repository’s
addon-config.json, which turns on OTel Container Insights and Application Signals and leaves Classic Container Insights off. - A workload that you instrumented for Application Signals.
- Python 3.12 or later and a current AWS Command Line Interface (AWS CLI).
- The IAM permissions listed in the repository README. Use a read-only role to run
probe.py. Use a separate, narrowly scoped deployment role to runalarms.sh,deploy.sh, andcleanup.sh. - A target Region where CloudWatch PromQL and OTel Container Insights are available.
Deploy the dashboards
Edit one file and run three commands. If you would rather delegate, open the repository folder in your AI assistant and ask it to run this setup for your cluster. The next section explains what the assistant knows.
Every script accepts DRY_RUN=1 to print the AWS commands instead of running them. config.py is the only file with environment values. The builder, the probe, and the shell scripts all import it, so targeting a new cluster is a configuration change. deploy.sh stops at the first FAILED query, prints every EMPTY for you to explain, and ends with DEPLOYED_MATCHES_BUILD=True after comparing the deployed NOC with the build. Expect one warning per PromQL chart widget stating that the x property is not expected. The warning is cosmetic, and omitting x fails validation. Then open the CloudWatch console and look at the NOC once.
Let your AI assistant do the customizing
You don’t need to become fluent in PromQL, dashboard JSON, or the Python builder to make this NOC yours. The repository ships an agent skill (.kiro/skills/eks-noc-dashboard/SKILL.md, summarized in AGENTS.md) for assistants such as Kiro. It teaches the file layout, the deploy order, and the rules that keep the dashboards trustworthy. Those rules are short: change configuration rather than generated JSON, keep every query cluster-scoped, zero-fill counters but never latencies, derive the Environment from the namespace, and treat FAILED as blocking. Open the folder in your AI assistant and describe what you want, for example:
- Set this NOC up for cluster
payments-prodin this account. The servicesapi,ledger, andnotifierrun in namespacepayments. - Add a widget for Amazon Simple Queue Service (Amazon SQS) queue depth for the
orders-eventsqueue to the application health drilldown. - The Availability gauge is blank. What is wrong, and what do I check?
- Show the same infrastructure panels for the clusters in eu-west-1 and eu-central-1 on one NOC.
The AI assistant edits config.py or the builder, reruns the tests and the probe, and reports the BODY_SHA256 it validated. You review the result on the console, which is the part that needs a human anyway.
Running the NOC across accounts and Regions
The sample targets one cluster in one account and Region. Fleet operators have three options, which differ in what a single PromQL expression can reach. CloudWatch cross-account observability links source accounts to a monitoring account within a Region. Application Signals services, service level objectives (SLOs), and the AWS service metrics roll up cleanly there. Both PromQL chart widgets and metric widgets accept an accountId on each query, so one NOC in the monitoring account can hold a panel per source account. The dashboard body also carries a Region on every widget and on every PromQL query. One NOC can therefore show Kubernetes panels for several Regions side by side, in any Region where PromQL is available. In both cases each query still evaluates in exactly one account and Region, so the Kubernetes panels and the executive rollups stay per Region.
To aggregate across the fleet in one expression or one alarm, use CloudWatch Metrics centralization. It copies metrics, including OTLP metrics, from source accounts and Regions in your AWS Organizations organization into a destination account. It adds @aws.account and @aws.region labels for PromQL. It centralizes only new data, and the destination account’s quotas apply. The multi-account guide in the repository compares the three options and describes the configuration change for each.
Operational considerations
The following costs grow with cluster count, so review them per environment rather than assuming the sample footprint:
- OTel Container Insights and Application Signals ingestion.
- PromQL dashboard and alarm evaluations.
- CloudWatch Logs Insights scans and log retention.
- Label cardinality on OTLP metrics.
Keep the environment-specific values in config.py: cluster name and namespaces, load balancer and target group identifiers, table and database names, and alarm names with the account they live in. Targeting a new cluster then stays a configuration change rather than a rewrite. Rerun the probe after every material dashboard change and keep the printed hash with the report. A stale report is not evidence for a current dashboard.
Clean up
Run ./cleanup.sh from the repository folder to delete the four dashboards and the three alarms. If you deployed the retail store sample application and the CloudWatch Observability add-on solely for this walkthrough, remove them too to stop ingestion charges.
Conclusion
This NOC gives an operator a path: land on one overview, decide which question matters, and open the dashboard that owns the next step. PromQL chart widgets and CloudWatch metric widgets share one view, and request-weighted rollups keep a quiet service from hiding a failing one. Zero-filled counters paired with freshness alarms make blank mean something, and a probe turns every dashboard change into a tested change. The sample repository carries the how, and your AI assistant can carry it the rest of the way to your cluster.
For more information, refer to OTel Container Insights for Amazon EKS, Amazon CloudWatch Application Signals, PromQL alarms, and the CloudWatch dashboard body structure reference. Two related posts extend this walkthrough. Introducing OpenTelemetry and PromQL support in Amazon CloudWatch explains the OTLP metrics store and PromQL query surface that this NOC builds on. Proactive Amazon EKS monitoring with Amazon CloudWatch Operator and AWS Control Plane metrics covers the vended AWS/EKS control plane metrics that complement the infrastructure drilldown.